

🧠 What This Project Was
This post walks through a Splunk syslog monitoring lab I built as part of my cybersecurity learning journey. The goal was to simulate a mini-SOC environment and get hands-on with log ingestion, parsing, and visualizations using Splunk.
🛠️ Tools Used
- Splunk Enterprise (Free Trial)
- Kali Linux VM
- Syslog sources:
/var/log/auth.log,/var/log/syslog - Dashboard Studio (Classic & Modern panels)
🔍 Project Goals
- Ingest and monitor syslog + auth logs
- Create dashboards for:
- Failed login attempts
- Sudo command activity
- Event trends by source
- Generate test log events and confirm ingestion
📸 Dashboard Panels
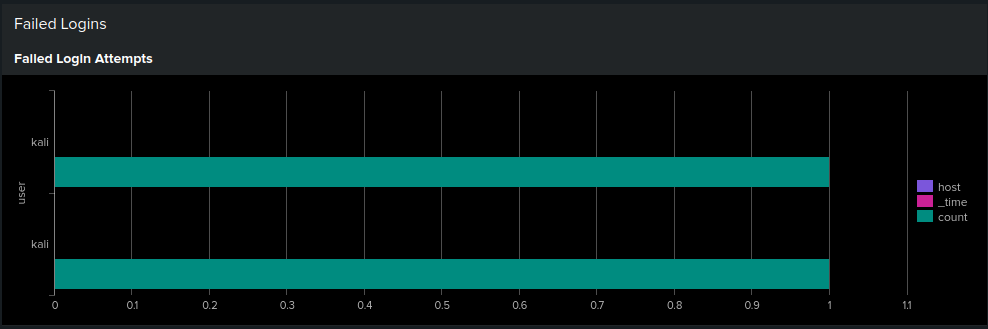
🔑 1. Failed Login Attempts
Bar chart showing failed logins by user and host.
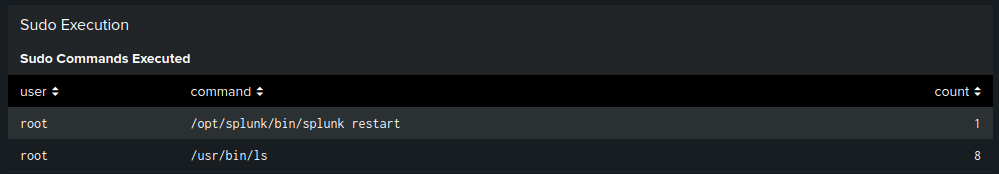
🧾 2. Sudo Commands Executed
Table of executed sudo commands with counts.
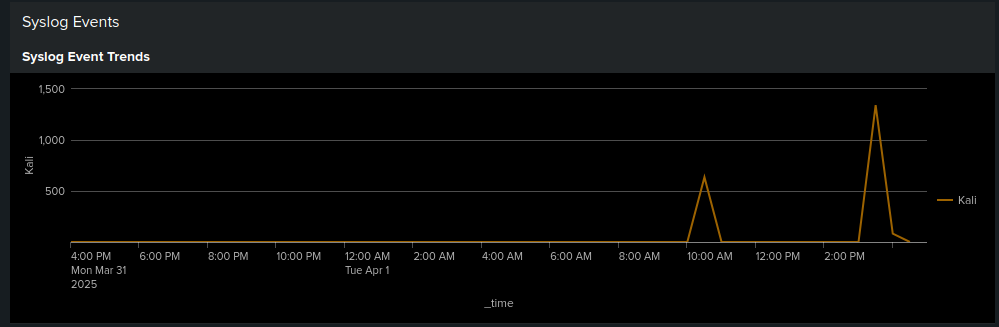
📈 3. Live Event Trends
Line graph showing syslog event frequency over time.
🔍 Key Search Queries
Here are the actual Splunk queries powering these panels:
🔐 Failed Logins
```spl index=* sourcetype=linux_secure “Failed password” | stats count by user, host
index=* source=”/var/log/auth.log” “sudo”
| rex “COMMAND=(?
🧠 Lessons Learned Real-time log tailing helped validate pipeline setup
Regex is essential for extracting command fields
Splunk’s visualization and alerting tools are powerful once configured
Troubleshooting ingestion was the biggest time sink (auth.log visibility issues)
✅ Next Steps Add Splunk alerts for brute-force attempts
Monitor DNS or iptables logs
Export logs to another SIEM like Wazuh or Graylog
This lab was one of the most hands-on and visual parts of my security learning journey so far.